2008年08月01日
2008年07月28日
課題1終了

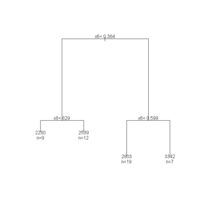
1) root 47 8343055.0 2706.255
2) x6< 0.364 21 906765.8 2406.762
4) x8< 829 9 123516.0 2230.333 *
5) x8>=829 12 292998.9 2539.083 *
3) x6>=0.364 26 4031279.0 2948.154
6) x6< 0.599 19 645973.2 2803.211 *
7) x6>=0.599 7 1902702.0 3341.571 *
x1:地域差指数総合
x2:地域差指数食料
x3:一人当たり県民所得
x4:県内総生産額対前年増加率
x5:県内総生産対前年増加
x6:財政力指数
x7:携帯電話
x8:パソコン所有数量
x9:第1次産業就業者比率
x10:保育所数
x11:労働災害発生の頻度
一人当たりの県民所得は財政力指数0.364で下位と上位別れ下位はパソコン所有量829で下位2230と上位2539に分かれる
上位は財政力指数0.599で下位2803と上位3342に分かれる
Posted by e051103 at
13:37
│Comments(0)
2008年07月07日
2008年06月30日
2008年06月16日
2008年06月09日
2008年05月26日
課題
 x<-read.table("n:/oecd1997.dat",header=T)
 > library(mvpart)
> kekka<-rpart(Country~.,data=x)
> plot(kekka)
> text(kekka)
>
Posted by e051103 at
14:15
│Comments(0)
2008年05月12日
課題
Call:
lm(formula = log(y) ~ log(x))
Residuals:
Min 1Q Median 3Q Max
-1.0158 -0.3376 -0.1032 0.2864 2.7844
Coefficients:
Estimate Std. Error t value Pr(>|t|)
(Intercept) 1.97836 0.06903 28.66 <2e-16 ***
log(x) 0.78525 0.07021 11.18 <2e-16 ***
---
Signif. codes: 0 '***' 0.001 '**' 0.01 '*' 0.05 '.' 0.1 ' ' 1
Residual standard error: 0.5374 on 95 degrees of freedom
(3 observations deleted due to missingness)
Multiple R-Squared: 0.5683, Adjusted R-squared: 0.5638
F-statistic: 125.1 on 1 and 95 DF, p-value: < 2.2e-16


Posted by e051103 at
14:06
│Comments(0)


